Real case · Large hospital
0%
Refrigerant loss in one chiller before detection. Two monitoring systems active. Neither caught it early.
Your BMS says the system is running. Your energy bill says something else. Your ESG report needs numbers you can defend. ClimaWISE builds the thermodynamic fingerprint of your installation, measured continuously and supplemented by AI where it adds certainty. We show you exactly what it is doing and what it is costing you.
Buildings rely on periodic maintenance intervals by a service engineer or facility staff without deep technical visibility. This gap allows leaks to persist for months. In a hospital case, the BMS and the supplier failed to see the drift. ClimaWISE identified the anomaly at 3%.
Refrigerant loss in one chiller before detection. Two monitoring systems active. Neither caught it early.
CO₂-equivalent from the undetected leak. More than most buildings emit in total energy use per year.
ClimaWISE detects refrigerant anomalies at 3% loss. This building's systems detected at 80%.
This is not an isolated incident. Refrigerant leakage is endemic in large HVAC-R systems. The problem is not the equipment. It is the absence of a system that understands the thermodynamic fingerprint well enough to detect what the sensors cannot see.
Your building management system confirms the installation is running and presents the associated sensor data. It cannot determine if that operation is correct based on your real time load, outdoor conditions, or the actual refrigerant charge. ClimaWISE validates the physics behind the data.
Same system. Same moment. Different story.
Cooling accounts for 30% to 40% of total data centre energy consumption. Growing AI workloads drive demand higher every year. Every point of PUE improvement is measurable in millions. ClimaWISE monitors cooling plant efficiency continuously and identifies exactly where PUE is being lost.
Hospitals cannot afford downtime. They face Paris Proof obligations and increasingly strict CO2 reporting requirements. ClimaWISE delivers both continuous reliability monitoring and the evidence trail needed for CO2 reduction reporting.
Government facilities are the frontrunners in energy regulation. This includes Paris Proof 2030, CSRD reporting, and energy label obligations. ClimaWISE provides the continuous measurement and provable savings data that makes compliance real instead of just claimed.
Large cooling plants with multiple chillers and complex distribution networks accumulate drift faster than anyone can manually track. ClimaWISE monitors all circuits simultaneously and prioritizes findings by energy impact.
The systems are different. The findings are consistent.
Chillers lose charge gradually. Efficiency drops and compressors work harder while CO2 impact accumulates. Standard detection methods catch the leak far too late.
Multiple chillers running independently instead of in optimised sequence. Each doing its own thing. Combined efficiency far below potential.
Fouling, scaling, or airflow issues reducing heat rejection capacity. The chiller compensates by working harder. Standard systems fail to connect these two.
Fresh air ratios fluctuate between 10% and 95% when they should stay stable and better based on CO₂. This causes enormous energy waste by conditioning outdoor air that is not needed.
Setpoints were defined at commissioning years ago for different conditions. These are never updated. The system operates on assumptions that no longer reflect what is required today.
Delta T collapse occurs in chilled water systems. Pumps work at full speed while delivering less cooling than the system thinks. Energy is wasted and capacity is lost.
These are not exceptions. These are standard findings in buildings that passed their last energy audit, in systems with active BMS monitoring, and in facilities where the installer says everything is fine based on the data they have.
Installers are experts at installing and servicing. They are not set up to provide continuous performance monitoring between visits. This is not a criticism, it is a structural gap. ClimaWISE fills that gap and works alongside installers instead of against them.
ClimaWISE is delivered through a Customer Agreement, combining an intelligence Stage with a Co-Pilot level. The Stage determines your visibility into the installation. The Co-Pilot determines how much ClimaWISE does for you.
Each Stage expands our visibility into your system. Scale up whenever you are ready.
Full visibility into the primary side. The thermodynamic profile of your chillers typically reveals 5 to 10% in system savings.
Active optimization with fast ROI. LeakShield AI and dynamic optimization realize up to 25% in total system savings.
Full insight into the interaction between primary and secondary side. Identifies an additional 7 to 12% in system savings.
Full synchronization of the entire installation. Up to 35% in total system savings under real operating conditions.
Every Agreement includes a Co-Pilot. The level determines how intensively we are involved, from monitoring to full operational relief.
Continuous monitoring and alerts. Includes reporting and predefined support hours for your team. You act, we inform.
Active optimization partnership. We set shared goals, conduct periodic performance reviews, and provide priority support. We optimize alongside you.
Recommended for CSRDFull tailored operational relief. Includes newbuild and construction phase guidance, independent review of quotations and installations, and support during FAT, SAT, and commissioning. We are involved from day one.
Every Stage gives us more visibility. Every Co-Pilot level determines what we do with that visibility for you.
This is physics in action. Explore our data, find our contribution to a better world and see how we make an impact.
In a small leak, a chiller slowly loses refrigerant. Efficiency drops and compressors have to work harder, while the CO₂ impact adds up. Standard detection methods catch the leak far too late, often only after 80% of the charge is gone. ClimaWISE detects refrigerant loss at just a 3% deviation through continuous thermodynamic analysis.
Multiple chillers running independently instead of in an optimised sequence all do their own thing, keeping combined efficiency far below potential. ClimaWISE identifies sequencing inefficiencies and delivers the data needed to properly coordinate chiller staging.
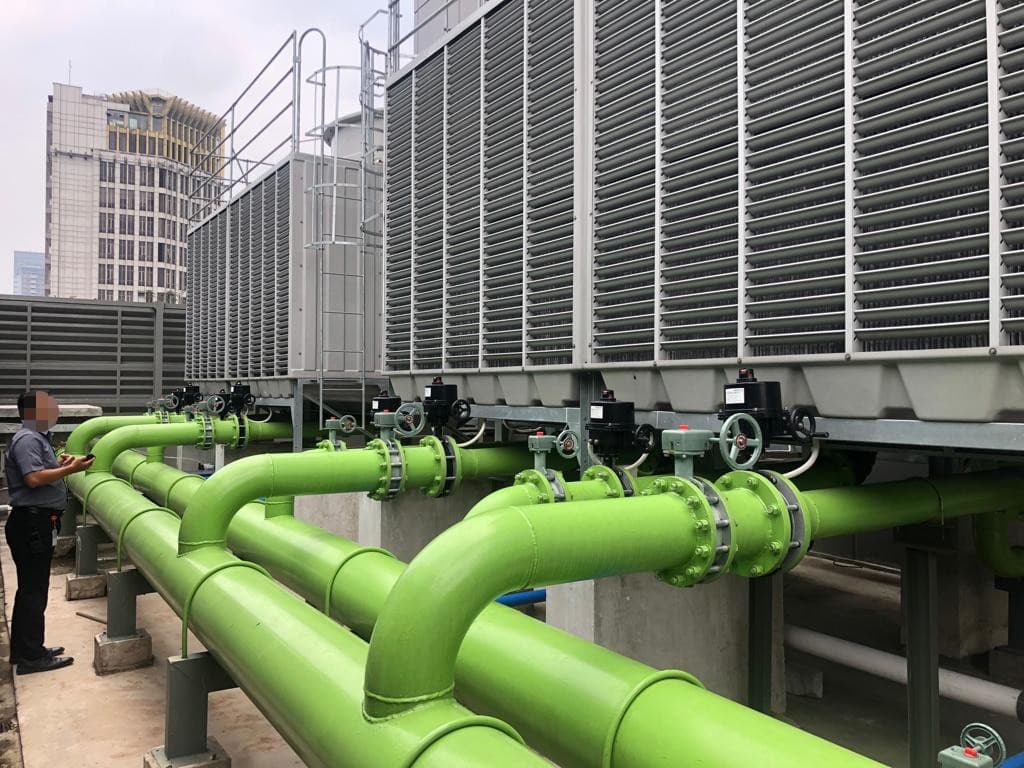
Fouling, scaling, or airflow issues reduce heat rejection capacity. The chiller compensates by working harder, consuming more energy and accelerating wear. Standard monitoring systems fail to connect cooling tower degradation to chiller overload. ClimaWISE tracks the full chain from heat rejection to compressor load.
Outdoor air ratios swing between 10% and 95% when they should stay stable and demand-driven based on CO₂ levels. This wastes enormous energy conditioning outdoor air that isn't needed. ClimaWISE identifies AHU control faults through continuous tracking of ventilation efficiency.
Control setpoints were locked in at commissioning years ago for conditions that no longer exist. They are never updated, so the system runs on assumptions that no longer match current requirements. ClimaWISE compares actual system behaviour to thermodynamic reality to pinpoint where setpoints have drifted from optimal.
Delta-T collapse occurs when the temperature difference across a chilled water loop drops below design value. Pumps run at full speed while delivering less cooling than the system expects, wasting energy and reducing available capacity. ClimaWISE detects delta-T collapse through continuous flow and temperature analysis.
Every building we connect shows performance drift that went unnoticed. Let us show you what yours looks like and what it is costing you.
Remote survey possible in most cases. ESG-ready reporting included.